The Popularity of Perl in 2013
As 2013 ended several articles were published covering the year in Perl:chromatic published the The Year in Perl 2013 Retrospective, a list of events in the life of the Perl programming language, and the people around it.
Neil Bowers published the The CPAN Report 2013 showing graphs and providing explanation about the activity on CPAN.
The Popularity of Perl
There are many ways to measure the popularity of a programming language. We are going to look at 4 measurements here:
- Perl Weekly subscribers
- Alexa
- Google Trends
- Google Analytics of search.cpan.org, blogs.perl.org, MetaCPAN, and Perl Maven
Perl Weekly
The Perl Weekly website itself does not get a lot of visitors. What is interesting there is the number of subscribers. It grew from 4156 on 1 January 2013 to 5103 on 31 December 2013. It's Google+ page was circled by 4,066 people on 1 January 2014. (I don't seem to have the number from the beginning og 2013.)
These numbers are, of course, more indicative to the popularity of the Perl Weekly, than that of Perl.
Alexa
The Alexa rankings provide a proximate ranking of web sites. It has big and strange fluctuations, but lacking more exact data, it can be a good indicator for the relative popularity of web sites.
Perl
| site | 15 Jan 2013 | 1 Jan 2014 |
| cpan.org | 10,222 | 8,807 |
| perl.org | 18,634 | 14,772 |
| perlmonks.org | 21,521 | 21,273 |
| metacpan.org | 143,975 | 73,877 |
| perlmaven.com | 679,764 | 199,901 |
| perl.com | 189,149 | 200,674 |
| perlmeme.org | na | 204,513 |
| perl-community.de | 465,767 | 259,690 |
| cpantesters.org | 553,281 | 265,792 |
| site | 15 Jan 2013 | 1 Jan 2014 |
| strawberryperl.com | 421,282 | 354,047 |
| template-toolkit.org | 535,891 | 407,008 |
| catalystframework.org | 679,637 | 447,718 |
| pm.org | 382,919 | 447,865 |
| perlgeek.de | 1,244,368 | 476,736 |
| mojolicio.us | 614,109 | 515,543 |
| modernperlbooks.com | 646,809 | 552,230 |
| perldancer.org | 612,468 | 566,055 |
| www.misc-perl-info.com | na | 597,487 |
| perlide.org | 941,509 | 799,919 |
| perlfoundation.org | 403,687 | 820,284 |
| perltricks.com | na | 910,000 |
| perlnews.org | 2,604,882 | 954,340 |
| perlhacks.com | 4,922,207 | 1,440,058 |
| perl6.org | 956,529 | 1,597,330 |
| perl-tutorial.org | 1,260,631 | 1,814,361 |
PHP
| site | 15 Jan 2013 | 1 Jan 2014 |
| php.net | 310 | 238 |
| drupal.org | 607 | 986 |
Python
| site | 15 Jan 2013 | 1 Jan 2014 |
| python.org | 4,249 | 3,874 |
| djangoproject.com | 12,708 | 9,599 |
| learnpythonthehardway.org | 88,649 | 42,028 |
Ruby
| site | 15 Jan 2013 | 1 Jan 2014 |
| rubyonrails.org | 11,646 | 11,117 |
| railscasts.com | na | 14,350 |
| ruby-lang.org | 27,786 | 32,001 |
| rubyinside.com | 109,559 | 112,446 |
Google Trends
Looking at the data during 2013 for the 4 major dynamic programming languages, this is what we get:
January 2013
              %
PHP     93   50.8
Python  42   22.9
Ruby    38   20.7
Perl    11    6.0
TOTAL: 184
December 2013
               %
PHP     90   49.7
Python  44   24.3
Ruby    37   20.4
Perl    10    5.5
TOTAL: 181
The first column is a number indicating the number of searches relative to all the searches in the world. As also explaind in an earlier article, it is natural that this is shrinking, even if the language is growing. What interests us more, is the relative weight of these 4 languages among themselves. This is what we see in the second column. The percentage of searches for the specific terms out of all the searches for any of these 4 terms.
While the changes are quite small and can be assigned to measurement errors, it still seems to be important to note that among these 4 languages the relative weight of Python grew, while the other 3 shrunk.
There was also a recent post comparing programming languages using the * tutorial phrase. It declared Python as the language of the year. Perl was not in the top 10 in the chart.
As someone pointed out, due to the increased usage of Node.js, we should probably take JavaScript in account:
In that case the numbers look like this:
January 2013
                 %
PHP         94   37.3
JavaScript  62   24.6
Python      43   17.1
Ruby        42   16.7
Perl        11    4.3
TOTAL:     252
December 2013
               %
PHP         91  37.0
JavaScript  64  26.0
Python      44  17.9
Ruby        37  15.0
Perl        10   4.1
TOTAL:     246
Google Analytics
The most accurate measurements we have, are the reports created by Google Analytics. A few weeks ago I got access to the data of MetaCPAN as well, so this time I can show both that, and the data of the Perl Maven site.
In the beginning of 2014 I also got access to the Google Analytics of blogs.perl.org and search.cpan.org.
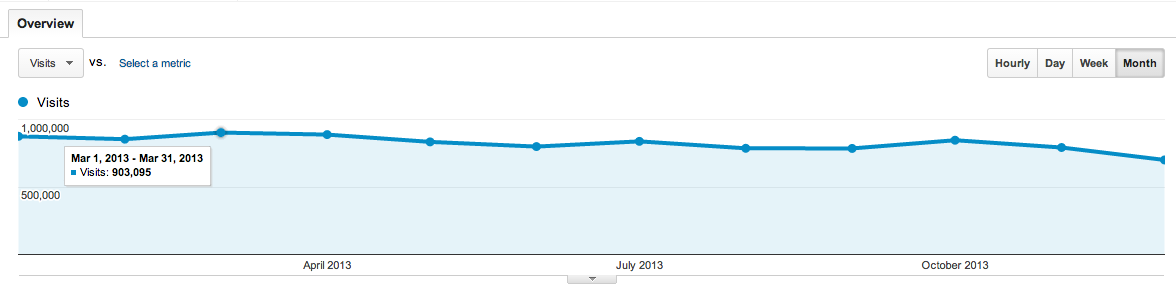
search.cpan.org
search.cpan.org monthly visitors count in 2013:
blogs.perl.org
blogs.perl.org monthly visitors count in 2013:
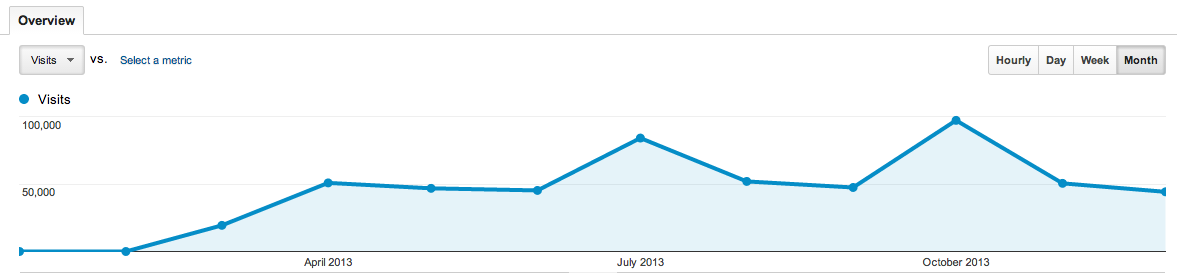
Some explanation about the blogs.perl.org numbers.
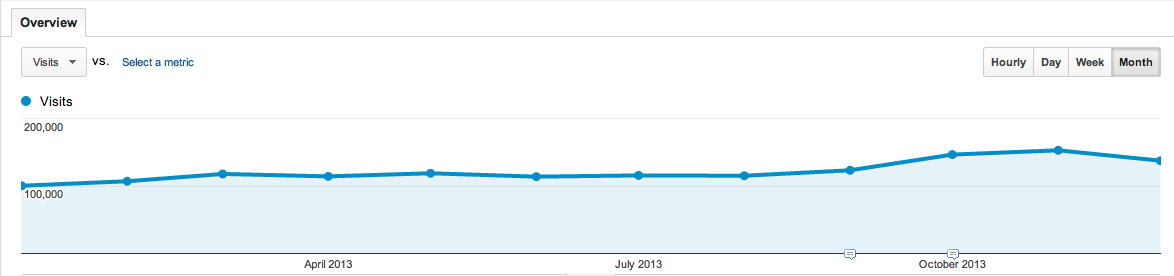
MetaCPAN
MetaCPAN monthly visitors count for 2013:
Perl Maven
Perl Maven monthly visitors count for 2013:
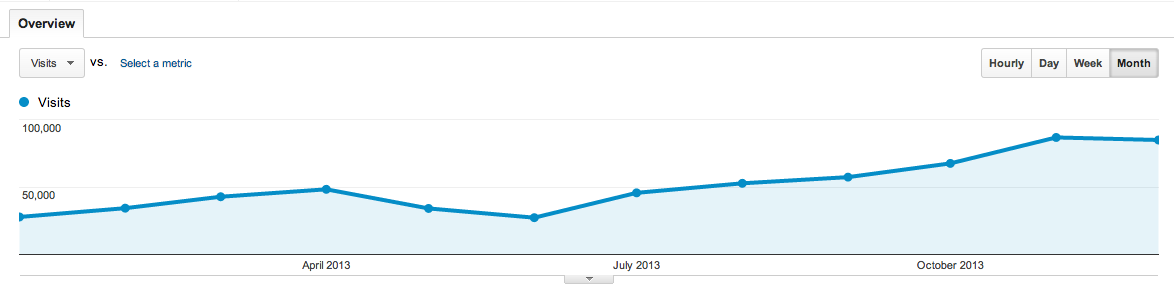
For earlier reports and an explanation of the hole in the graph of the Perl Maven site, check out the article from 1 August 2013, three month after switching domain names.
Annual growth rate
Number of visits in December 2012 and December 2013:
December 2012 December 2013 Annual change
blogs.perl.org n/a 44,195
perlmaven.com 17,815 84,810 376.1%
metacpan.org 82,138 137,474 67.4%
search.cpan.org 742,564 700,382 -5.7%
CPAN total 824,702 837,856 1.6%
CPAN total is metacpan.org+search.cpan.org blogs.perl.org enabled Google Analytics only in April 2013.
Data from perl.org and perl.com
I don't have access to the Google Analytics of the other perl.org sites, but I got some data from Ask Bjørn Hansen, one of the owners and admins of perl.org. (Beginning of February 2014).
- perldoc.perl.org has about a million page views a month over ~500k visits.
- perl.org 130k visits.
- perl.com 70k visits.
The rest of the sites have less than 50k visitors a month.
At a glance then except for learn.perl.org traffic has been pretty much flat for 4-5 years.
learn.perl.org has been growing from ~12k/month to 40k visits a month over the last 4 years, though likely that's related to the redesign a few years ago.